Composable SVG map charts for data visualization in React.
Compose map charts the same way you would write any other layout. Fully typed mature api with high test coverage, built on d3-geo and topojson.
How it works
Install react-simple-maps, compose your map as you would any other React layout, bind geographic data, and visualize it on a map.
Install
$ npm install react-simple-mapsCompose
import {
  ComposableMap, Geographies, Geography
} from "react-simple-maps/core"

const geoUrl = "/my-map-file.json"

const UsaMap () => (
  <ComposableMap projection="geoAlbersUsa">
    <Geographies geography={geoUrl}>
      {({ geographies }) => geographies.map(geo => (
        <Geography
          key={geo.rsmKey}
          geography={geo}
          fill="#0066FF"
          fillOpacity={Math.random()}
        />
      ))}
    </Geographies>
  </ComposableMap>
)
Visualize
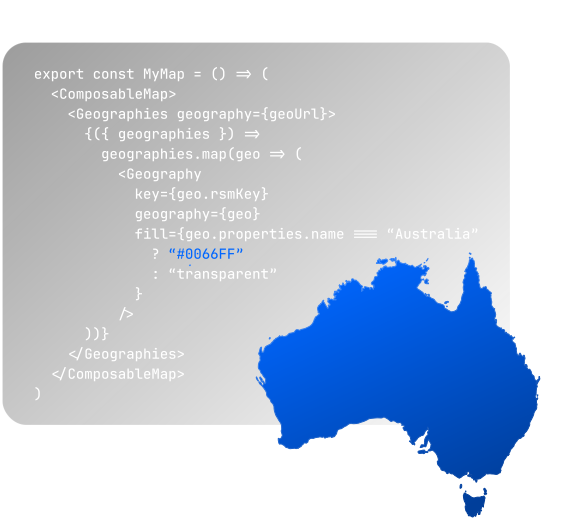
Compose maps like boxes in any web layout
React Simple Maps consists of a set of small helper components you compose yourself, so building a map chart is closer to regular web layout than configuring a charting library.
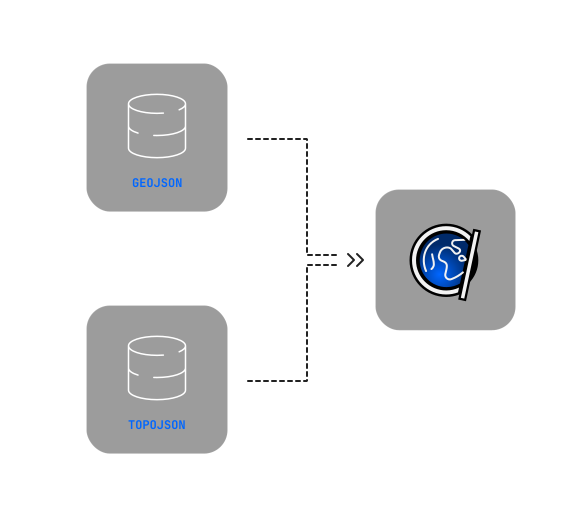
Bring your own map files
Country borders, state lines, rivers, land cover, or Sasquatch sightings. If it has coordinates, or you have a GeoJSON or TopoJSON file, you can map it with React Simple Maps.
Tried and tested for almost 10 years
React Simple Maps is almost a decade old. Throughout that time, the core idea and the API have stayed largely the same. It just works*.
*Now fully typed and with over 90% test coverage.